GEO 509: Report Fall 2022
An analysis of flood-prone infrastructure and conditions in selected Eastern Kentucky watersheds.
Department of Geography
The University of Kentucky, College of Arts and Sciences
August 24–December 14, 2022
Table of Contents
- GEO 509: Report Fall 2022
July 2022
In July 2022, eastern Kentucky experienced historic and devastating flash flooding created by 14–16 inches of rainfall in a 5-day period. The National Weather Service gave a 1 in 1000 chance of this much rain falling during this period of time. Although rain did not fall continuously, rainfall rates of 4 inches per hour were recorded. 1
 Figure 1: Rainfall estimates from the NWS
In late August, the American Red Cross reported over 1,600 homes destroyed or severely damaged in the area sending hundreds of families to emergency shelters.2 Kentuckians For The Commonwealth documented 36 fatalities due to the event.3
Figure 2: Flood Fatalities (Note: exact locations have been slightly randomized). Enlarge.
Course Goals
GEO 509 explored new geospatial technologies and data in a studio-style course format. Participants developed workflows using Kentucky’s extensive archive of lidar point clouds (which shows topographic relief and above-ground features in unprecedented detail) and aerial imagery to analyze flood-prone infrastructure. Three geoprocessing workflows were developed:
- Map bridges, especially private bridges, and estimate their vulnerability to flooding.
- Model flood extent with a height above river (HAR) analysis to identify inundated structures.
- Quantify potentially contributing factors that increase flood risk such as wide-scale terrain modification from surface coal mining.
This report documents our process and outcomes and provides a template for organizations to assess their flood risks.
Communities
At the beginning of the semester, participants selected a community in southeastern Kentucky that experienced flooding during this event. For their area of interest (AOI), they extracted the USGS National Hydrography Dataset (NHD) watershed boundary polygon that contained the community.4 The watershed extent could either use the twelve or ten digit hydrologic unit code.
Figure 3: Community and watershed locations with links to participants' reports. Enlarge.
Bridges
Bridges are critical infrastructure and susceptible to damage during floods. The National Bridge Inventory (NBI) catalogs federal, state, and county bridges as a point layer.5 However, many local and private bridges are not included in the dataset. Roads and housing settlements follow stream networks in Eastern Kentucky; private bridges are essential for communities to access transportation. As of September, 423 private bridges in twelve counties were damaged in the flood event.6
To locate uncataloged bridges, we used KyFromAbove 2019 6-inch aerial imagery7 as reference imagery to heads-up digitize missing features and correct misplaced NBI bridges. When digitizing the bridge point, participants were encouraged to place the point on the deck above the stream centerline, but away from any tree cover. After georeferencing bridges, we discovered that nearly 70% of bridges in our watershed AOIs were uncataloged in the NBI dataset.
Figure 4: RL Martens' draft map showing bridges over a shaded relief and population map. Enlarge.
The above figure illustrates the terrain in which many of our communities live. The terrain is rugged and mostly forested. The shaded relief shows canopy cover in the heavily textured areas. Smooth areas show denuded land representing valley bottom communities and mining sites at the higher elevations. The population map shows the population density of the area as a dot density map using the 2020 US Census blocks.8 Because Census blocks are larger in rural areas, the population dot density method is not an accurate representation of the population in the area. Population primarily clusters along the stream network.
In an effort to better understand the population density in the area, we used a choropleth representation of density. We merged our bridges into a single layer and created a population density map for our AOIs.
Figure 5: Updated and corrected bridge locations with population density by Census block. Enlarge.
Bridge georeferencing outcomes
Bridges are critical elements of infrastructure in mountain communities. As noted, nearly 70% of the bridges located were not cataloged in the NBI dataset. To understand the built environment, we relied on high-resolution imagery but lacked local knowledge of the area to evaluate small or canopy obscured features. Additional inspection of the georeferenced points should occur to remove false positives, e.g., culverts and structures that appear to be bridges but are not. Visualizing accurate population density in rural areas is difficult because of large Census blocks.
Invitation for community contribution of bridges
The process of identifying bridges is a tedious task that requires close inspection of the aerial photography. This task is likely helped with local knowledge of the area. To facilitate the contribution of private or uncataloged bridges, a web map with a PostgreSQL database was deployed to add bridges.
Figure 6: Invite community addition of bridges using aerial photography. Enlarge.
Bridge Heights
After making a comprehensive map of bridges in our watersheds, the next goal was to attribute the locations with height above stream. The workflow used digital surface models derived from KyFromAbove point clouds9. The two models were:
- Digital elevation model (DEM) models bare-earth elevations.
- Digial surface mdoel (DSM) models above-ground features as represented by the lidar first-return point cloud.
For every bridge location, the DEM was subtracted from the DSM to approximate bridge height above stream. That value was then added as an attribute to the bridge layer. An ArcGIS Pro Jupyter Notebook documents the steps.
As a proxy for a site visit, we created point cloud models of three bridges in each watershed to interactively measure the bridge heights using this ArcGIS Pro Jupyter Notebook. We then created presentations summarizing our findings.
Figure 7: Miles Whitlock’s map estimating bridge heights using lidar point clouds. Enlarge.
Bridge height analysis outcomes
The map shown in Figure 6 has bridges with height attributes that can be accessed by clicking a bridge location. In instances where the bridge height is low, e.g., less than two feet above the stream, we have discovered the following:
- The bridge point is a culvert.
- The bridge is captured in the DEM, which is likely an error in the source data.
- The bridge point is not on the bridge deck, but on the bare-earth DEM.
For unexpectedly high bridge heights, we have discovered the following:
- The bridge is covered by tree canopy.
- The bridge has above-deck features, e.g., a guardrail or girder.
While we planned a field trip to verify this approach by physically measuring a bridge, we were unable to visit any of our sites. See the Addendum for a site visit on UKy’s campus to verify this methodology.
Flood extent and inundation model
During peak flooding, many river gauges recorded record-breaking water levels. The river gauge for the North Fork Kentucky River at Whitesburg, Kentucky in Letcher County recorded an 18-foot increase in water levels before the gauge was destroyed by the flood. The gauge for the North Fork Kentucky River at Jackson in Breathitt County had a 25-foot increase in water levels.10
Figure 8: Kentucky River at Whitesburg, KY. July 29, 2022
With the assumption that water levels could rise 25 feet, we created a flood inundation model using the DSM from the previous bridge height analysis. This model interpolated a relative elevation model from corrected stream centerlines (a time-consuming process of heads-up digitizing) that produce elevations relative to the stream. This analysis is commonly referred to as a height above river (HAR) model. Since we used the DSM, the model recognizes heights of above-ground features including trees, buildings, bridges, etc. The model was created using this ArcGIS Pro Jupyter Notebook.
Figure 9: Bea Abbott’s HAR model. Enlarge.
Enlarging this figure will show areas up to 25 feet above the river. The dark strips over the river represent bridges that area higher than 25 feet. The following figure shows all models and bridges.
Figure 10: Inundation models for AOIs with attributed bridges. Enlarge.
Animations were created to visualize the flood extent and inundation model. The first animation uses the DSM for inundation model which shows where above-ground features are above the 25-foot flood extent. The second animation uses a bare-earth DEM and vertical exaggeration to emphasize the terrain and flood extent.
Figure 11: Dilni Abeyrathne’s animation
Figure 12: Reece Foley’s animation
Inundation model outcomes
This attempt to model inundation makes no claim to represent actual flood conditions during this event. Rather, this approach could identify flood extent in isolated areas if the flood height is known. The model can corroborate bridge heights derived in the previous analysis.
Terrain modification
Eastern Kentucky has produced coal for over a century with mountain top removal (MTR) being the dominant method of coal extraction in recent decades. MTR is a controversial practice that involves the removal of the top of a mountain to expose the coal seam. The top of the mountain is then replaced with a mixture of soil in a process of reclamation. The practice has been criticized for its environmental impact, including the loss of habitat, the contamination of waterways, and the increase of flooding severity. Jack Sparado, former Director of the U.S. Department of Labor’s National Mine Health and Safety Academy, says, “There is no question that mining was a major factor in the severity of flooding,” during this July event.11
Improperly reclaimed MTR sites have poor rainfall water infiltration creating more runoff. Active MTR sites have collection ponds. The Lost Creek community in Breathitt County filed a lawsuit against Blackhawk Mining, LLC which operates a strip mine above the community. The lawsuit states, “based on information they have received, (the coal companies) operated a number of silt ponds which failed due to the fact that they were improperly maintained and improperly constructed… The failure of the silt ponds caused debris and excessive water to flow onto the Plaintiffs’ properties and caused damages” during this event.12
To quantify the extent of MTR mining in eastern Kentucky, we used the SkyTruth MTR dataset. This dataset is a compilation of satellite imagery from 1985 to 2020. It shows surface mining and includes rock quarries, but the majority of mining in eastern Kentucky is coal mining. The dataset was created by SkyTruth, a non-profit organization that uses satellite imagery to monitor environmental impacts.13
Figure 13: SkyTruth cumulative mined area, 1985–2020. Enlarge.
The vector dataset of mining extent was intersected with 12-digit HUCs watershed boundary layer to find percent of watershed in MTR and also intersected with US Census block groups8 to find acres of MTR per person.

Figure 14: Ryan Kraft’s map of mined areas. Enlarge.
The below interactive figures allow you to explore the MTR dataset. The first figure shows the percent of watershed in MTR. Watersheds that have greater than 0.1% of it’s land area in the SkyTruth dataset are shown in this map.
Figure 15: MTR by percent of watershed. Enlarge.
The second figure shows the acres of MTR per person. These areas represent Census block groups with greater than 1 acre of land in the SkyTruth dataset.
Figure 16: MTR by acres per person. Enlarge.
Terrain modification model outcomes
SkyTruth data shows cumulative mining over a period of 35 years. While we could have selected more recent years for analysis, we used the entire dataset to show extent of mining in eastern Kentucky. When a mine is no longer active, the land can remain modified for many years. Comparing this data with 2019 high-resolution aerial imagery, we find modified areas regardless of the data’s time period. How to quantify the degree of modification is beyond the goal of this report.
Summary
We have demonstrated several workflows using Kentucky’s latest high-resolution elevation and imagery products. The successful outcomes of these workflows depend on the accurate locations of features, e.g., bridges and stream centerlines, which require precise manual heads-up digitizing. However, once an accurate dataset is created, we can attribute features with height information by comparing the DSM with the DEM. These features could then be used by communities to assess flood risk and plan for future events.
While this course used ArcGIS Pro to conduct our analyses, we recommend that these workflows use open-source solutions, such as QGIS. An open-source approach doesn’t require licensing fees and would allow for more community participation in the analysis.
We discussed how to address mining extent and flood fatalities because of reporting in the media. To be clear, we make no claim that mining contributed to fatalities; that analysis is well beyond the scope of this report. Yet, we can make some observations. For the entire area shown in the below figure, the percent of modified land is 4.8%. For all watersheds with a flood fatality, the percent of modified land is 13.5%.
Figure 17: Watersheds with modified terrain, with flood fatalities. Enlarge.
Using radar-based rainfall estimates14, we can observe that the heaviest rainfall aligns with the cluster of flood fatalities.
Figure 18: Radar estimate of rainfall during event with flood fatalities. Enlarge.
Contributors
- Bea Abbott link
- Dilni Abeyrathne link
- Reece Foley link
- Ryan Kraft link
- RL Martens link
- Boyd Shearer link
- Miles Whitlock link
Interactive Maps
- Watershed areas of interest with links to contributor reports link
- Flood Fatalities (Note: exact locations have been slightly randomized) link
- Updated and corrected bridge locations with population density by Census block link
- Add bridges using aerial photography link
- Inundation model with attributed bridges link
- SkyTruth cumulative mined area, 1985–2020 link
- Mined areas by percent watershed link
- Mined areas by acres per person link
- Watersheds with modified terrain, with flood fatalities link
- Radar estimate of rainfall during event with flood fatalities link
Addendum - Site visit to verify bridge height methodology
On December 10, 2022, a bridge on UKy’s campus was measured with an iPhone 13 and its Measure app and lidar sensor. We measured the height of the bridge from the top of the deck to the ground at 15' 2" (14' 5" from the ground to the bottom of the deck plus an estimated 9" thick deck). Interactive measurement of the point cloud shows a height of 15' 4" while the subtraction of the DEM from the DSM gives a height of 15' 3".
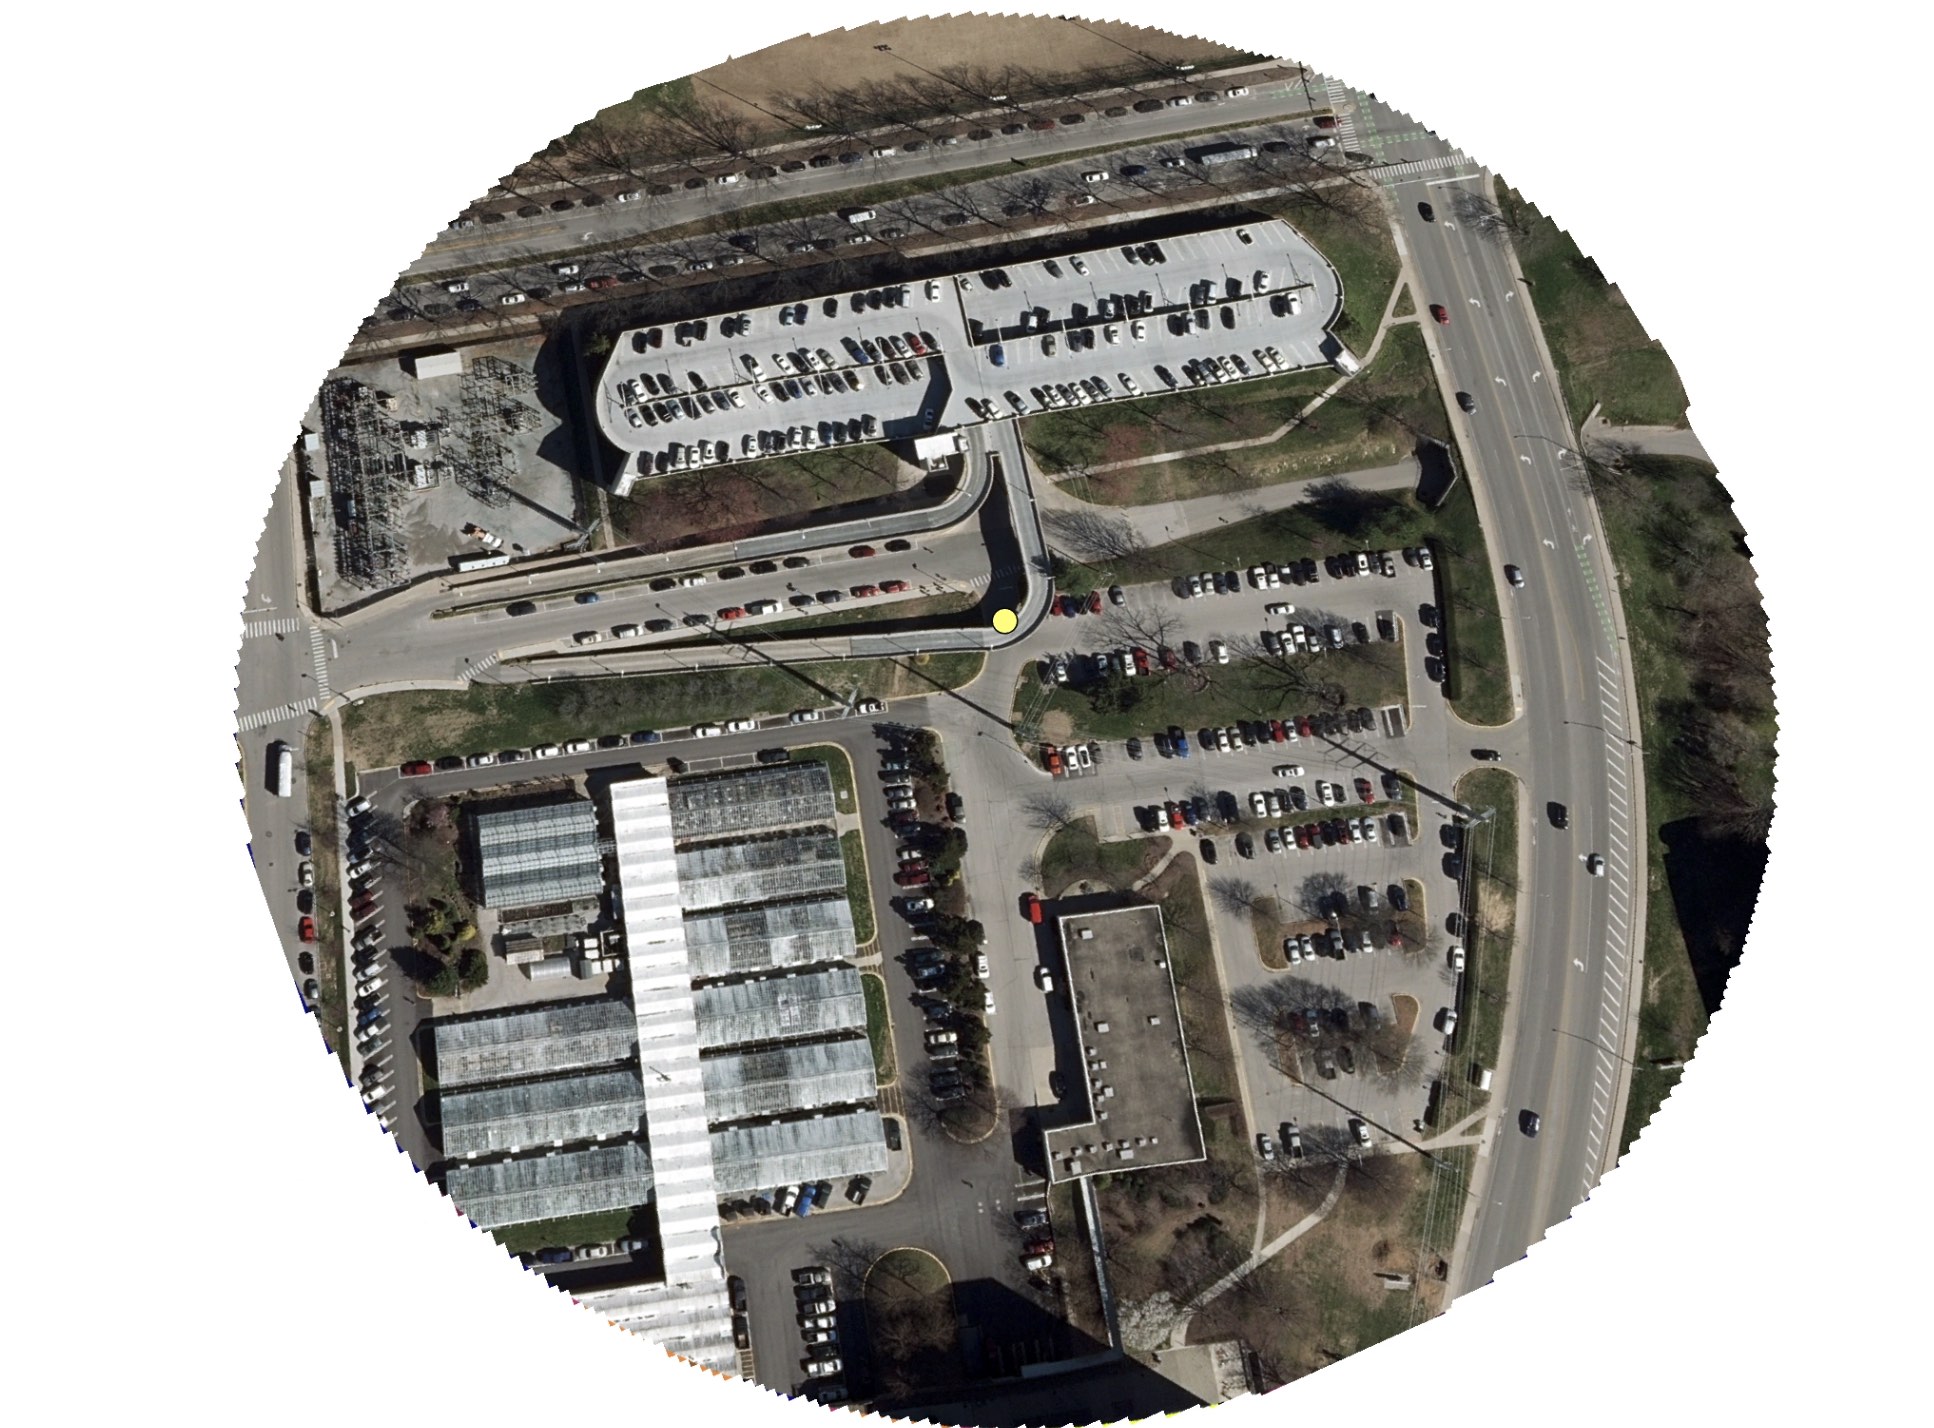
Figure 19: Site of bridge on campus
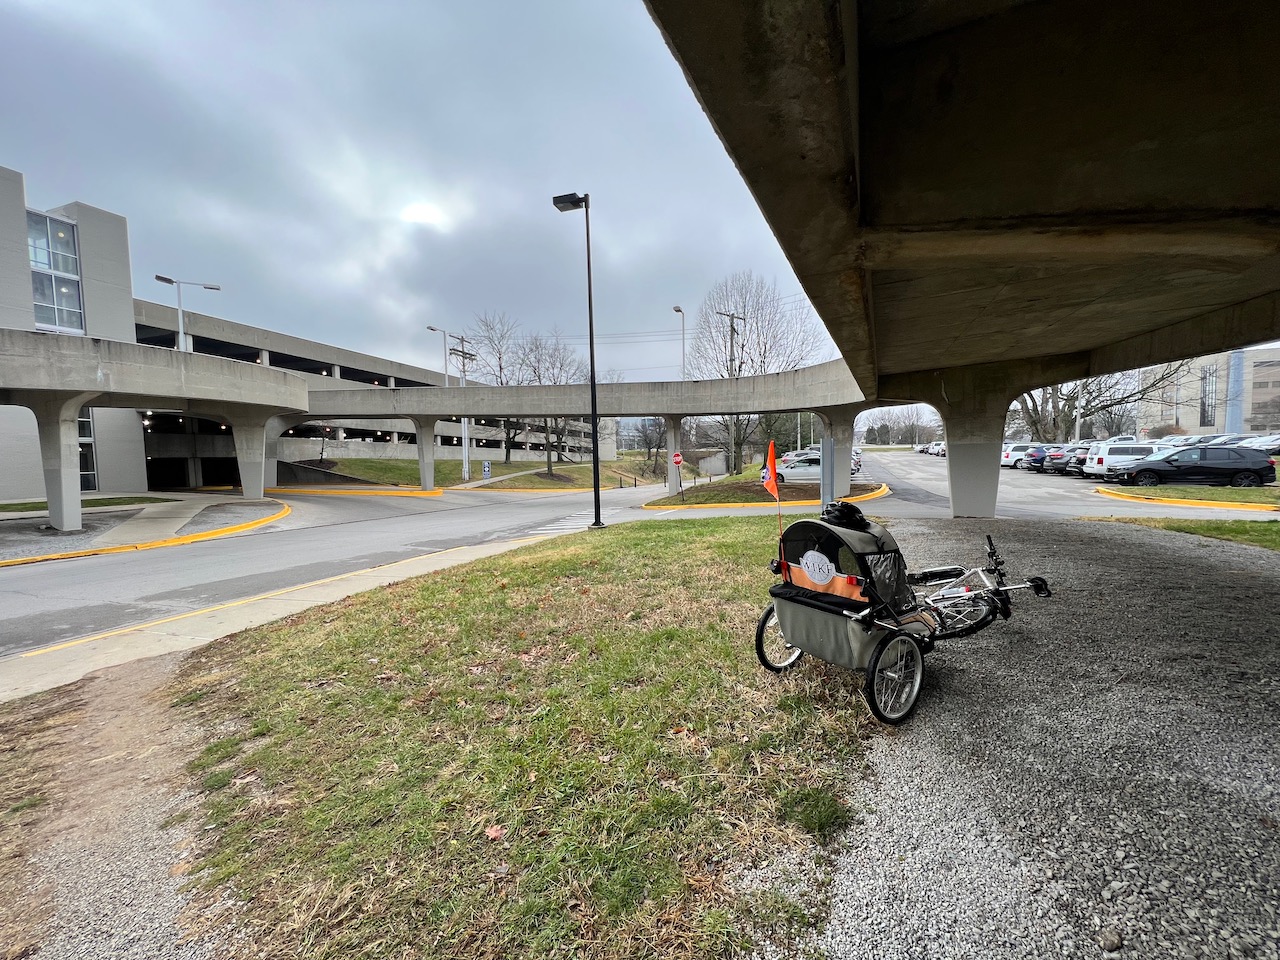
Figure 20: Site of bridge on campus
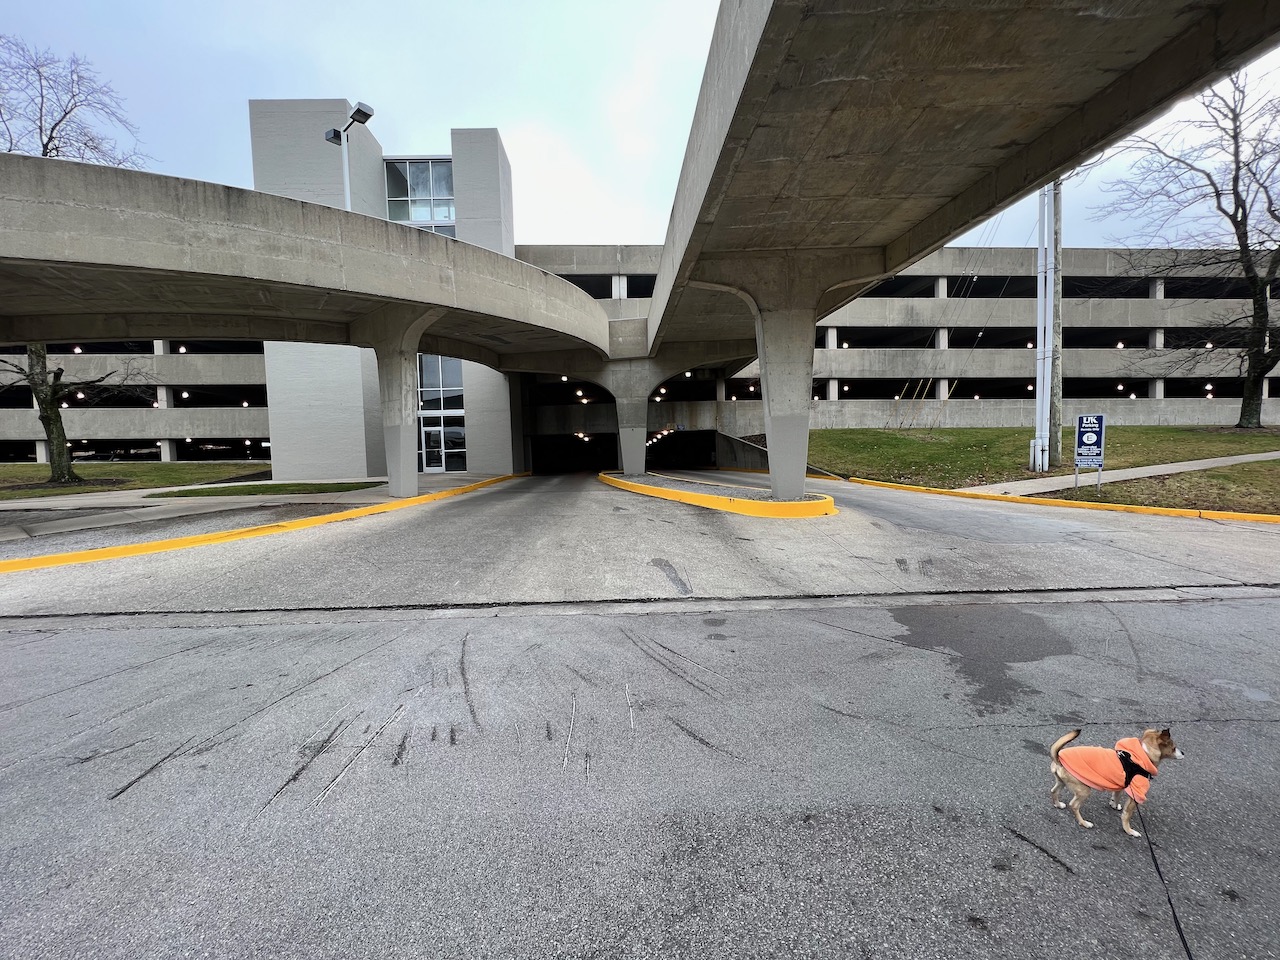
Figure 21: Below bridge deck
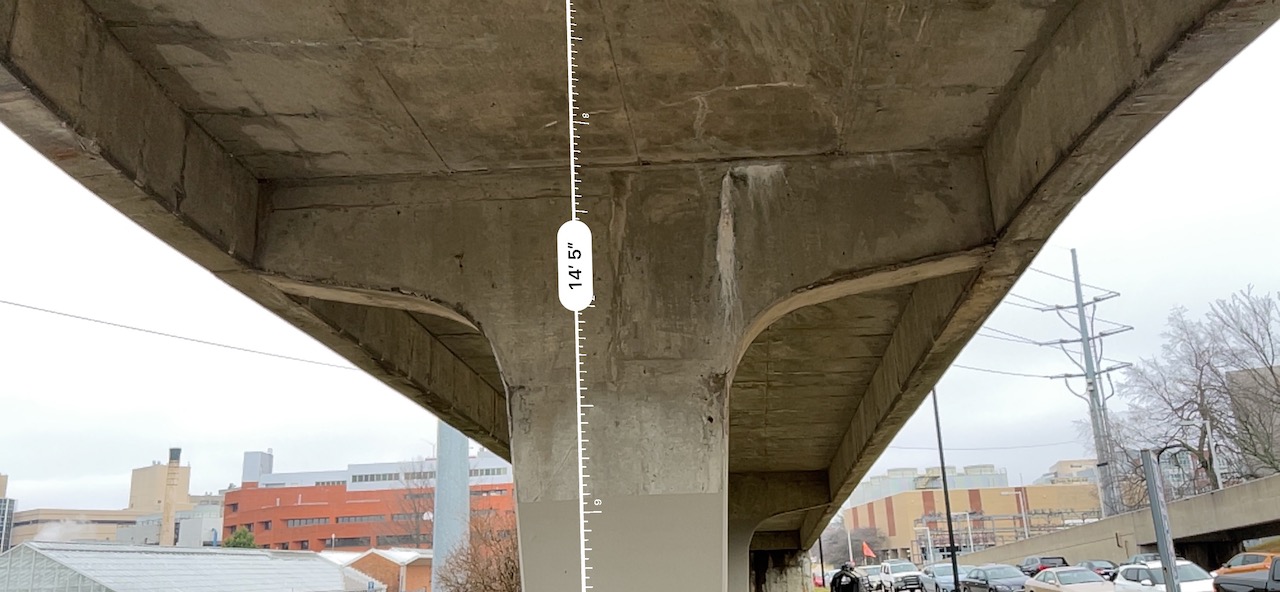
Figure 22: iPhone 13 Measure app showing height of bridge from ground to bottom of deck
Figure 23: Above bridge deck
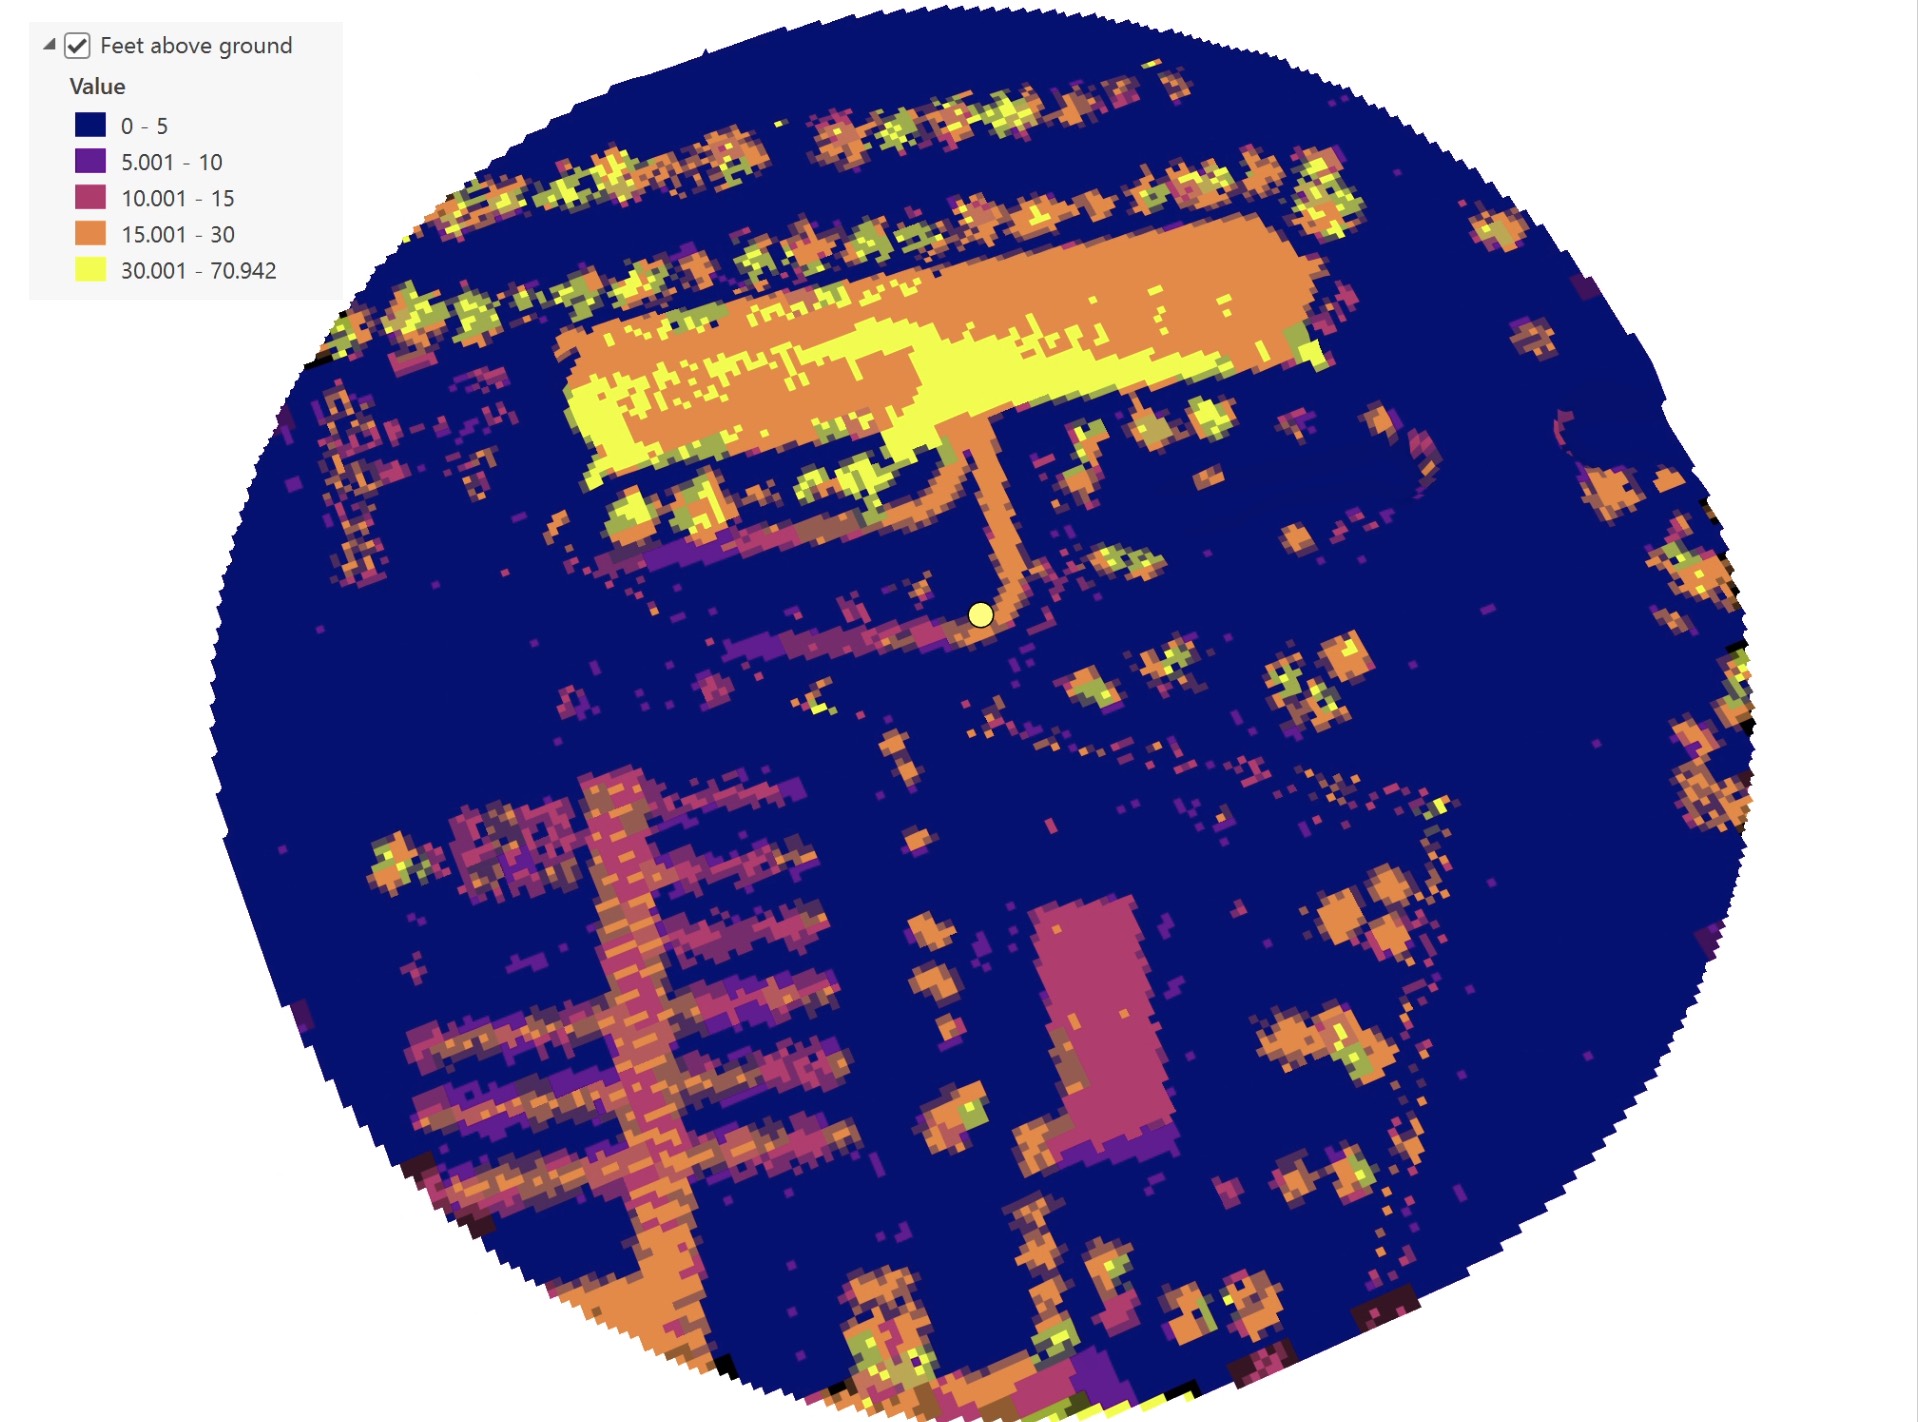
Figure 24: DSM minus DEM
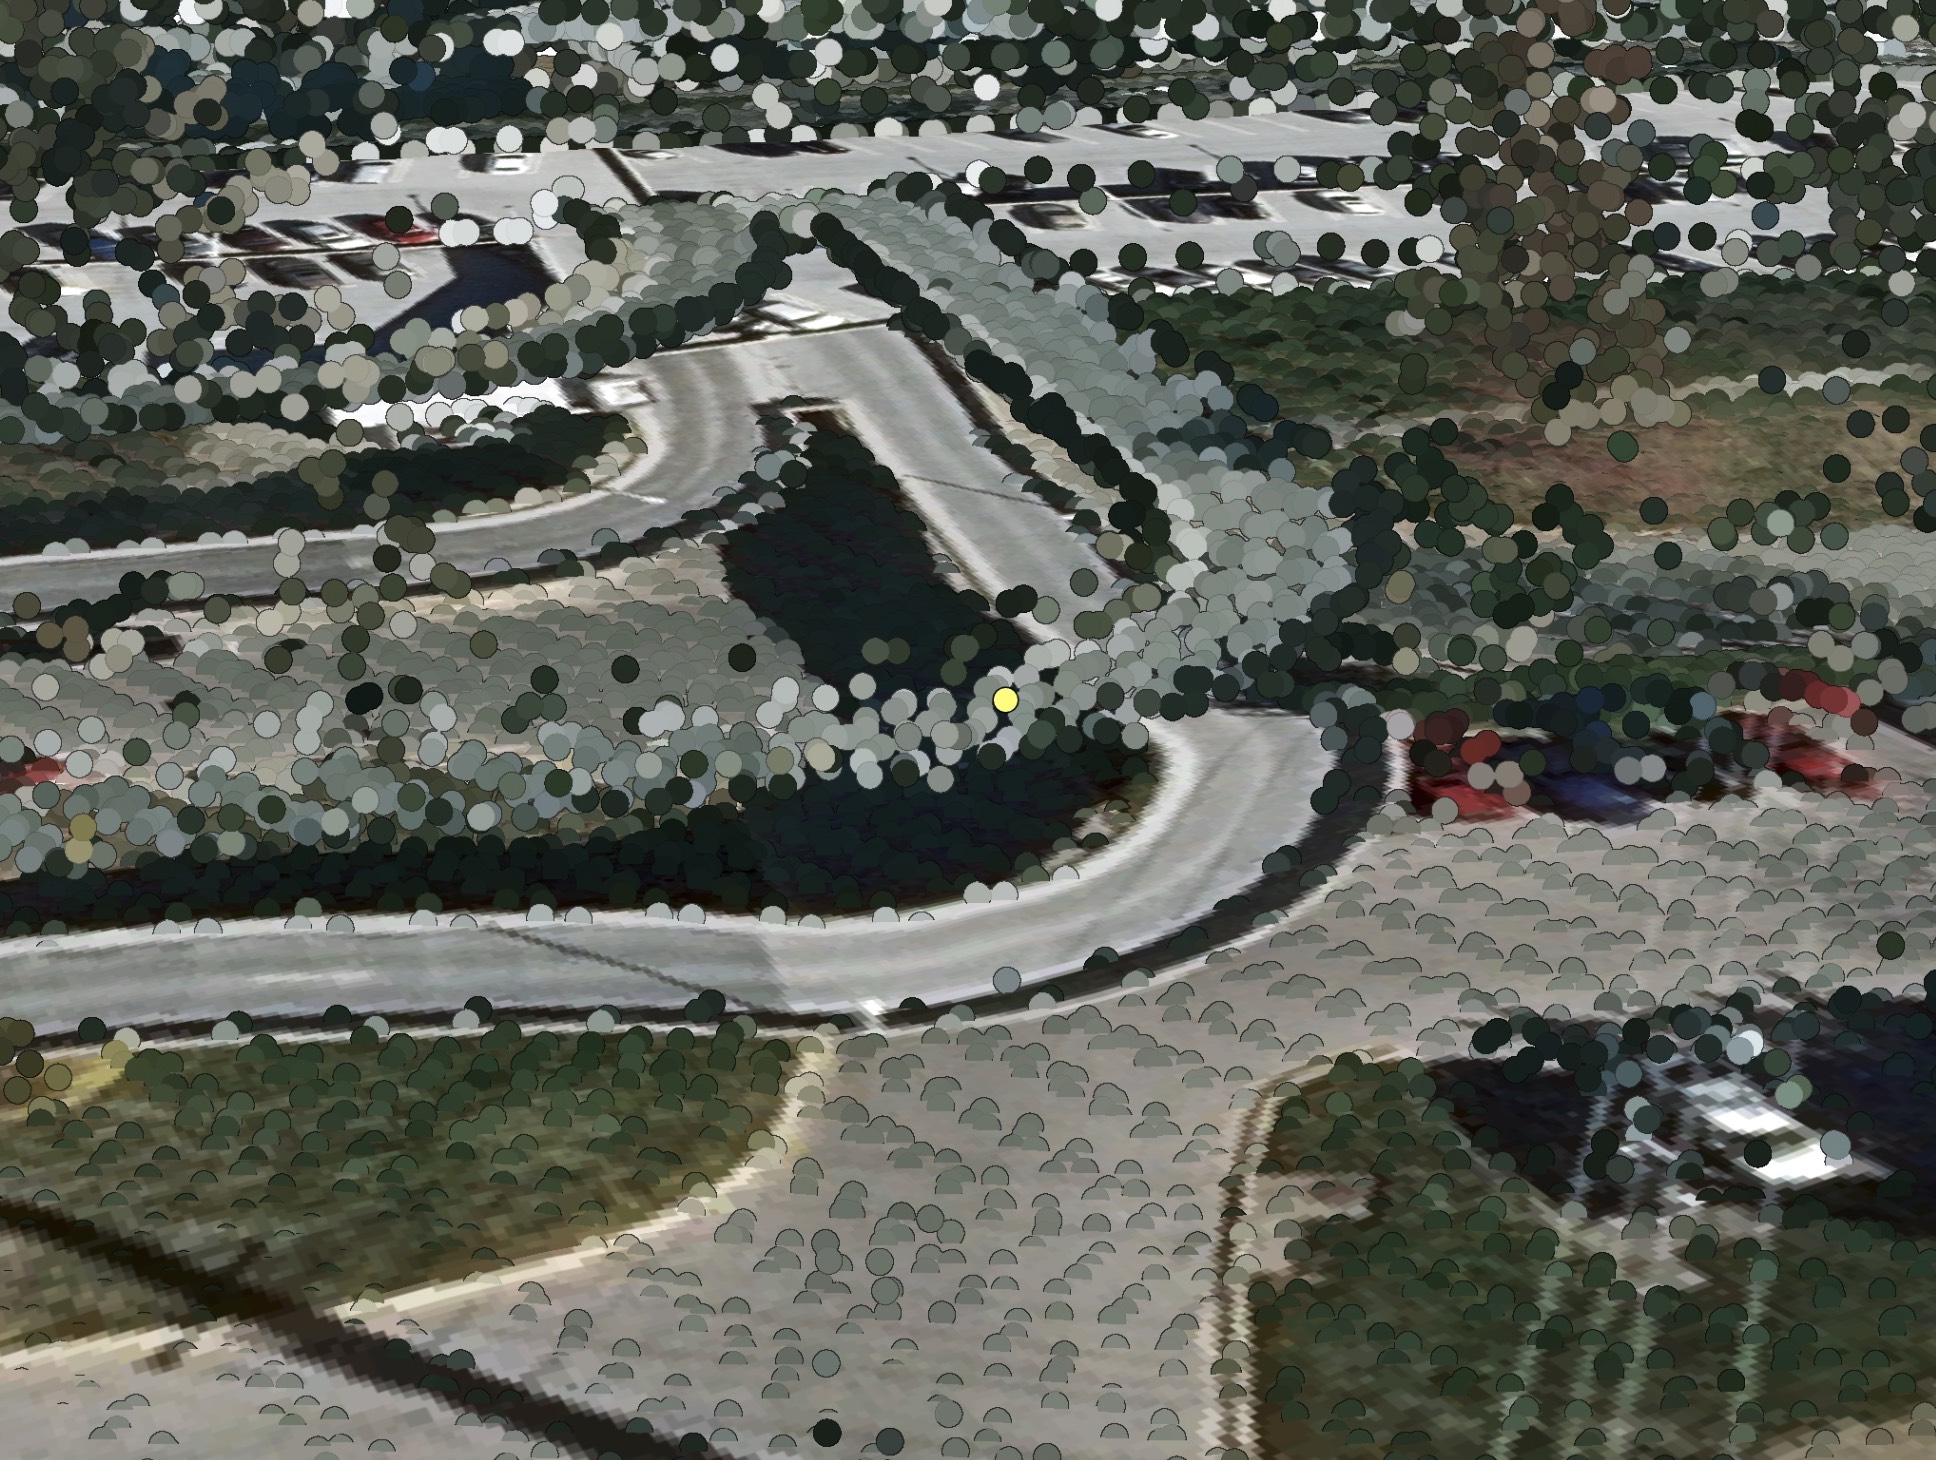
Figure 25: Point cloud of bridge
References
1 National Weather Service, Jackson, KY. (2022, August). Historic July 26th-July 30th, 2022 Eastern Kentucky Flooding. URL
2 Bill Estep. (2022, August 25). Tents, sheds become makeshift homes in EKy. as residents seek long-term housing after floods. Lexington Herald-Leader. URL
3 Kentuckians For The Commonwealth. (2022, October 18). URL
4 USGS. (2022, September). NHDPlus High Resolution (NHDPlus HR). The National Map Download (v2.0) service. URL
5 Kentucky Transportation Cabinet. (2022, September). National Bridge Inventory. URL
6 Aaron Mudd. (2022, September 8). Flooding damaged hundreds of private bridges in Eastern KY. Some could get FEMA relief. Lexington Herald-Leader. URL
7 KyFromAbove. (2022, September). Kentucky Natural Color Imagery. URL
8 US Census Bureau. (2021, October). 2020: DEC Redistricting Data (PL 94-171). URL
9 KyFromAbove. (2022, October). Kentucky LiDAR Point Cloud Data. URL
10 Christopher Leach. (2022, August 5). How much did the North Fork Kentucky River rise in Eastern KY during floods? Lexington Herald-Leader. URL
11 Campbell Robertson. (2022, October 29). Months After the Floods, Eastern Kentucky Families Take Measure of What Was Lost. New York Times. URL
12 Russ Cassady. (2022, August 25). Lawsuit alleges coal company to blame in Breathitt flooding. Hazard Herald. URL
13 SkyTruth. (2022, November). MTM Data Files. URL
14 National Weather Service. (2022, December). Advanced Hydrological Prediction Service. URL
About the Department of Geography
Located in Lexington, Kentucky, the Department of Geography at the University of Kentucky was established in 1944. The department is consistently ranked among leading geography graduate programs in the United States. Our department would make a great home for your major or minor in Geography and all things wildly spatial!
https://en.wikipedia.org/wiki/Department_of_Geography,_University_of_Kentucky

.